Introduction
Chronic kidney disease (CKD) affects more than 35 million adults in the United States, with nearly 800,000 people experiencing kidney failure1. Kidney transplantation is the preferred treatment option for kidney failure, offering better survival and quality of life compared to dialysis2. However, the demand for donor kidneys far exceeds supply, leaving most patients reliant on dialysis. More than 70% of individuals with kidney failure do not receive a transplant3,4, and ~10% of those on the waiting list either die or are removed each year due to disease progression5.
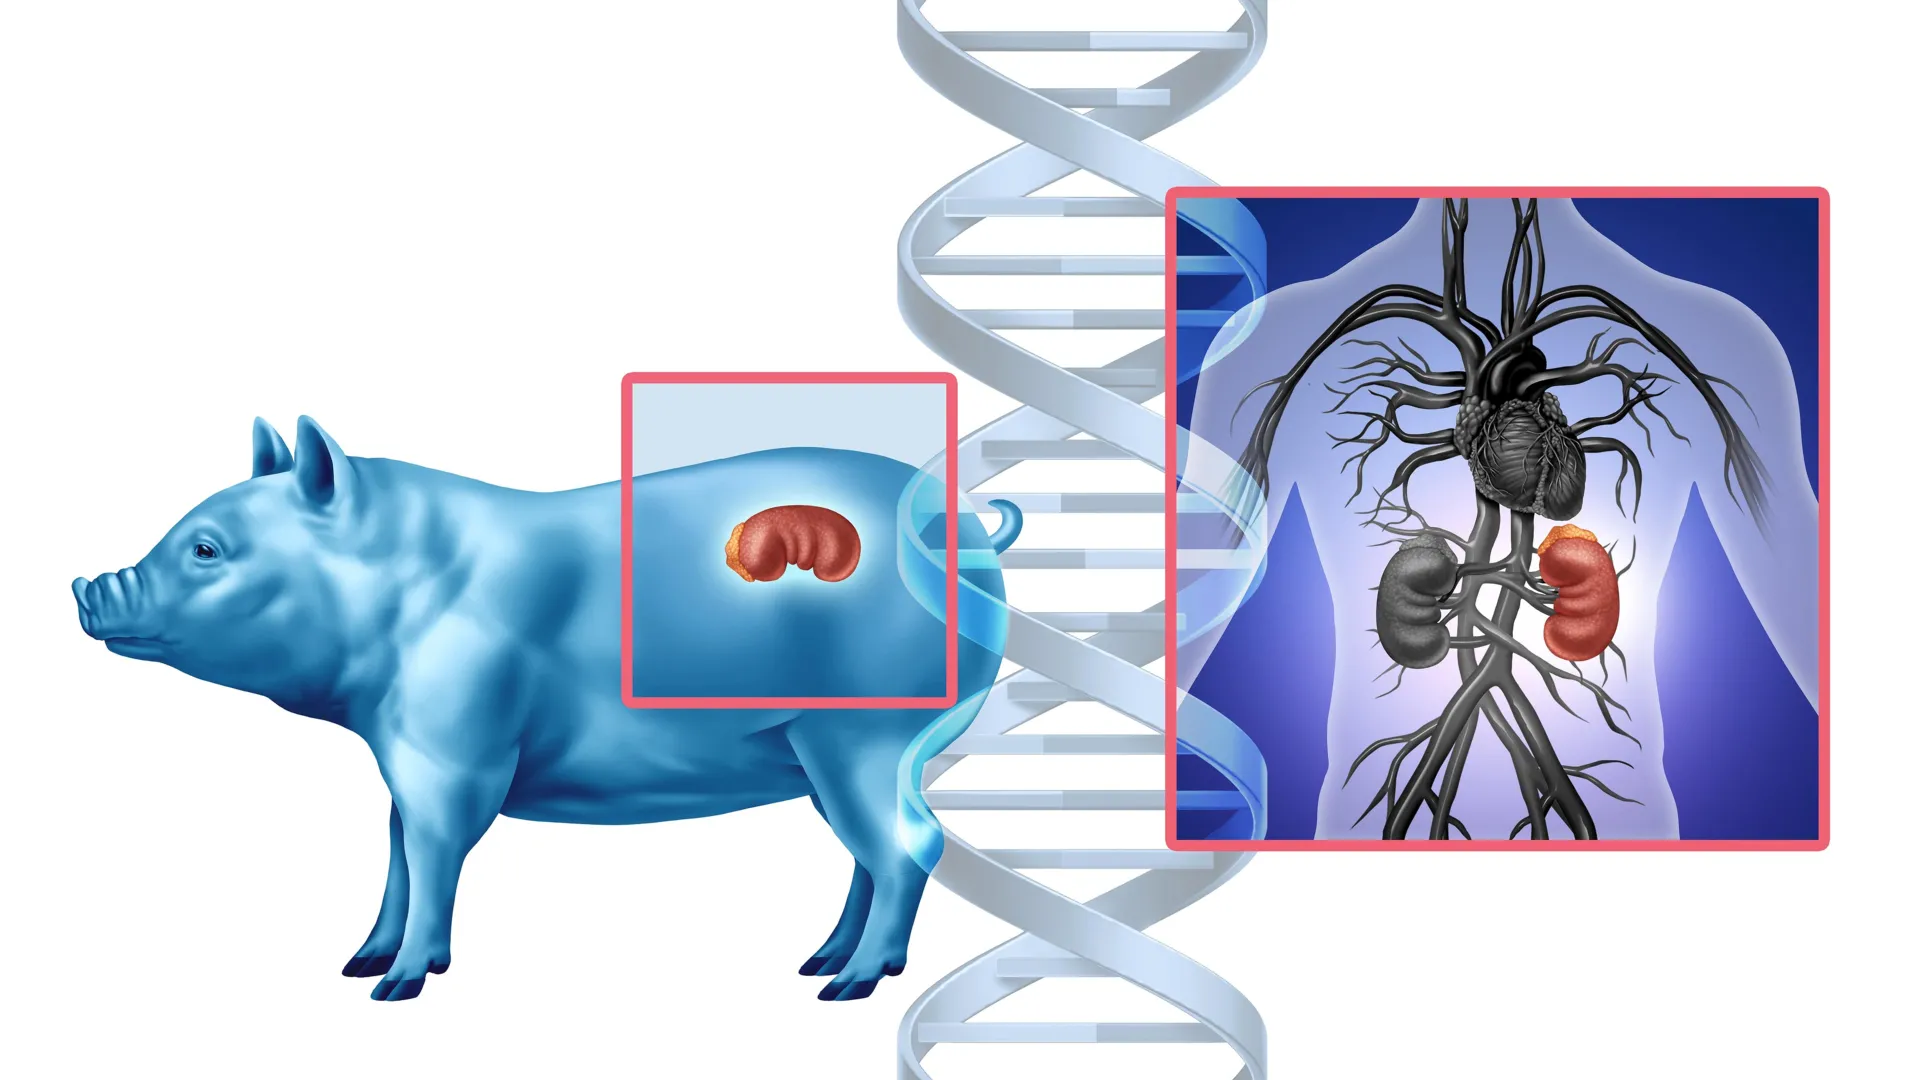
Xenotransplantation, using genetically modified pig kidneys, offers a potential solution to the organ shortage crisis by providing an unlimited supply of transplantable organs6. Advances in genetic engineering have helped overcome key immune barriers and reduce the risk of thrombosis and viral transmission7,8,9. Preclinical studies in non-human primates have demonstrated the safety, efficacy, and durability of pig kidney xenografts7,10,11, and short-term experiments in the human decedent model have provided critical insights into their compatibility to humans12,13,14.
Building on these advances, the first pig-to-human kidney xenotransplantation in a living recipient was performed on March 16, 2024, at Massachusetts General Hospital15. This landmark procedure offered an unprecedented opportunity to evaluate porcine kidney function in a living human, free from the physiological limitations of short-lasting brain-dead models.
Here, we report key physiological observations from the first-in-human porcine kidney xenograft over a 51 day postoperative follow-up period, including glomerular filtration, electrolyte and water regulation, acid-base balance, calcium-phosphate homeostasis, uric acid and magnesium handling, and erythropoiesis. This first-in-human case provides critical insights into the metabolic capacity of a pig kidney in sustaining normal human renal physiology, helping to refine future xenotransplantation strategies and expand access to life-saving kidney transplants.
Results
Patient Characteristics
A 62 year-old man with end-stage kidney disease was selected for porcine kidney xenotransplantation after failing a previous kidney transplant and experiencing significant challenges with dialysis access. His medical history included hypertension, insulin-dependent type 2 diabetes, extensive vascular calcification, prior myocardial infarction, peripheral artery disease, and heart failure with preserved ejection fraction. He had also undergone parathyroidectomy for tertiary hyperparathyroidism, resulting in undetectable parathyroid hormone (PTH) levels. At the time of transplantation, he had no residual kidney function.
Blood chemistry analysis of genetically modified pigs
The baseline blood chemistry of Yucatan miniature pigs with the same genotype as the donor pig (ESUS-1784) was assessed to reinforce their suitability as organ donors for electrolyte and metabolic handling post-xenotransplantation (Supplemental Table 1). Compared to wild-type Yucatan pigs (N = 4), these genetically modified pigs (N = 4) exhibited no major differences in electrolyte levels with similar median levels of sodium [138 mmol/L, interquartile range (IQR) 136−140) vs. 137 mmol/L, IQR 135−137 in wild type], potassium (3.9 mmol/L, IQR 3.6-3.9 vs. 4.1 mmol/L, IQR 4.0-4.1 in wild type), chloride (100 mmol/L, IQR 99-102 vs. 98 mmol/L, IQR 97-98 in wild type), bicarbonate (27 mmol/L, IQR 26-28 vs. 26 mmol/L, IQR 25-28 in wild type) concentrations. However, genetically modified pigs had slightly lower baseline creatinine levels (median 0.7 mg/dL, IQR 0.6-0.7 vs 1.2 mg/dL, IQR 1.0-1.4 in wild type).
The genetically modified pigs also exhibited baseline sodium, potassium, magnesium, creatinine, and blood urea nitrogen levels comparable to human reference values, further suggesting the limited risk of metabolic mismatches following xenotransplantation. However, they exhibited a slightly higher bicarbonate concentration (median: 27 mmol/L, IQR 26-27; human mean: 24 mmol/L) and higher serum phosphorus levels (median: 6.2 mg/dL, IQR: 6.0-6.4; human mean: 3.5) relative to humans.
Glomerular Filtration Rate
The xenograft demonstrated early graft function, with a creatinine clearance (CrCl) of 43 mL/min/1.73 m² by post-operative day (POD) 3. Acute kidney injury due to cellular rejection on POD 8 led to a decline in CrCl to below 10 mL/min/1.73 m². Following treatment, kidney function recovered, reaching a CrCl of 64 mL/min/1.73 m² by POD 35 (Fig. 1A). Serum creatinine- and cystatin C-based estimated glomerular filtration rates (eGFR) remained stable after rejection resolution, averaging 44 ± 4 and 42 ± 3 ml/min/1.73 m2, respectively, with a minor decline after POD 48 (Fig. 1B). The mean difference between creatinine-based eGFR and cystain C-based eGFR was 4 ± 5. Trends in serum creatinine and cystatin C levels are shown in Supplemental Fig. 1.
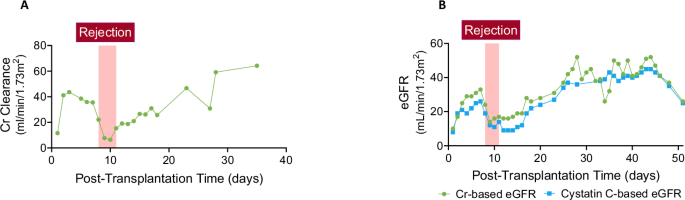
A Trend of body surface area (BSA)-adjusted Cr clearance over time following xenotransplantation. B Trends in GFR, estimated by serum Cr (in green) and cystatin C (in blue), post-xenotransplantation. The acute kidney injury phase caused by rejection is highlighted with a red box. Source data are provided as a Source Data file. Abbreviations: Cr creatinine, GFR glomerular filtration rate, eGFR estimated glomerular filtration rate.
Hemodynamic Regulation and Sodium Handling
Hemodynamic stability was closely monitored due to concerns that porcine renin may have a limited capacity to activate the renin-angiotensin-aldosterone system (RAAS) in humans based on prior experiments in non-human primates16. Despite this, the recipient maintained blood pressure throughout the post-transplant period (Fig. 2A). The xenograft avidly retained sodium, as evidenced by low 24 h urine sodium excretion (mostly <100 mmol/day, except during recovery from acute kidney injury) and low fractional excretion of sodium (Fig. 2B and Supplemental Fig. 2). Signs of volume expansion emerged, indicated by increased body weight, presumably due to underlying heart failure, necessitating antihypertensive medications and diuretics (Fig. 2C). NT-proBNP level was elevated post-transplant (4,916 pg/mL on POD 42), consistent with persistent volume overload in the setting of pre-existing heart failure. The xenograft remained sodium avid despite the use of diuretics, and there was no evidence of transplant renal artery stenosis on repeated renal ultrasounds. A detailed record of anti-hypertensive and diuretic medications is available in Supplemental Table 2.
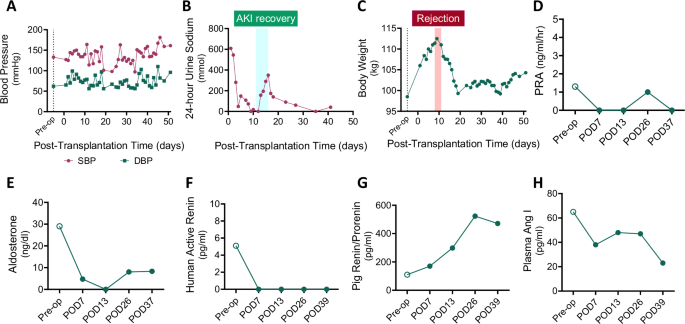
A Changes in systolic and diastolic blood pressure following xenotransplantation. B Twenty-four hour urine sodium excretion trend. C Fluctuations in body weight post-transplant. Levels of (D) PRA, (E) serum aldosterone, (F) plasma human active renin, (G) plasma pig-derived renin, and (H) plasma angiotensin I are depicted. EDTA plasma was obtained from the recipient before (Pre-Tx, open circle) and four different times after kidney xenotransplantation (closed circles). Values below the detectability limit are shown as 0 in the graphs. The acute kidney injury phase caused by rejection is highlighted with a red box and the recovery phase is marked with a light blue box. Source data are provided as a Source Data file. SBP, systolic blood pressure; DBP, diastolic blood pressure; PRA, plasma renin activity; POD, post-operative days.
Renin-Angiotensin-Aldosterone System
Plasma components of the RAAS were measured before and after xenotransplantation. Post-transplant, plasma renin activity (PRA) was suppressed, and serum aldosterone levels were reduced (Figs. 2D and 2E). Human plasma active renin was undetectable by enzyme-linked immunosorbent assay (ELISA) in the post-transplant period, in contrast to control samples from human kidney allograft recipients (control median: 7.1 pg/ml, interquartile range 1.4-17.0) (Fig. 2F). By contrast, porcine xenograft-derived renin increased markedly post-transplant (range: 170−523 pg/ml) (Fig. 2G). In the absence of detectable human active renin protein, plasma angiotensin I levels decreased post-transplantation as compared to pre-transplantation values (range: 23−48 pg/ml post-operatively vs. 65 pg/ml pre-operatively) (Fig. 2H). These findings suggest that blood pressure was maintained without RAAS activation in the absence of hypovolemia, and the sodium retention observed in the recipient was mediated by RAAS-independent mechanisms.
Water Handling
Given concerns about the potential incompatibility of human anti-diuretic hormone (ADH) with the porcine kidney vasopressin V2 receptors, urine output was closely monitored post-transplant. Of note, the patient had no residual kidney function from the native kidneys prior to transplantation. On POD 1, xenograft urine output was 6.2 L/day, gradually decreasing to 2.3 L/day by POD 7. In the setting of acute kidney injury due to rejection on POD 9, urine output declined to 0.8 L/day but recovered after treatment, remaining between 1.2–3.5 L/day thereafter (Fig. 3A).
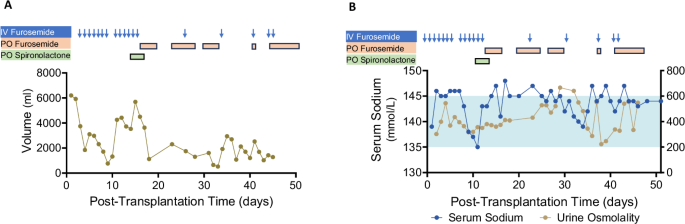
A Urine output trends shown alongside diuretic administration history. B Serum sodium levels (blue) and urine osmolality (khaki) are shown. The timing of diuretic administrations is indicated by arrows and boxes. The light blue shaded area represents the normal serum sodium range. Source data are provided as a Source Data file.
Serum sodium levels were generally within the normal range but trended toward the high-normal end, with intermittent mild hypernatremia. This occurred in the context of ongoing loop diuretic use and limited fluid intake due to concerns about peripheral edema and elevated body weight (Fig. 3B). Urine osmolality ranged from 223−666 mOsm/kg water, suggesting preserved concentrating capacity of the xenograft and responsiveness to human ADH. However, transiently low urine osmolality with mild hypernatremia was observed between POD 36–39, resolving without intervention (Fig. 3B).
For a comprehensive assessment of xenograft water regulation and electrolyte balance, both electrolyte-free water clearance (CEFW) and solute-free water clearance (CH2O) were measured. The CEFW remained below 2 L/day, and CH2O was negative on most days (Supplemental Fig. 3). A summary of total fluid intake, including crystalloid and colloid administration, is available in Supplemental Table 3.
Acid-Base Balance
The recipient developed moderate metabolic alkalosis, evidenced by high venous pH (7.46-7.48) and elevated serum bicarbonate levels (33-39 mmol/L) in the absence of respiratory alkalosis (pCO2 52−59 mmHg) (Supplemental Fig. 4A). Persistent diuretic use for volume management, high-dose oral calcium carbonate, and pulse-dose intravenous corticosteroids—administered at transplant and during rejection treatment—likely contributed to this imbalance.
Urinary chloride concentration remained elevated ( > 20 mmol/L), while urine pH was low (5.5-6.0) (Supplemental Fig. 4B). In the setting of ongoing diuretics use, serum potassium levels were mostly within the normal range but remained in the low-normal range after POD 36, requiring daily potassium supplementation (Supplemental Fig. 4C). Urinary potassium excretion was elevated, with a urine potassium/creatinine ratio consistently > 18 mmol/g during this period.
Calcium and Phosphate Balance
Serum calcium levels remained low (8.0 ± 0.5 mg/dL) due to the recipient’s post-parathyroidectomy hypoparathyroidism (Fig. 4A), while serum albumin levels were mostly normal. Fractional excretion of calcium remained below 0.5% and 24 hour urinary calcium excretion was consistently <150 mg, indicating preserved renal calcium-conserving capacity in response to hypocalcemia (Fig. 4B). The patient received intermittent intravenous calcium chloride while hospitalized and continued high-dose oral calcium carbonate and calcitriol therapy (Supplemental Table 4).
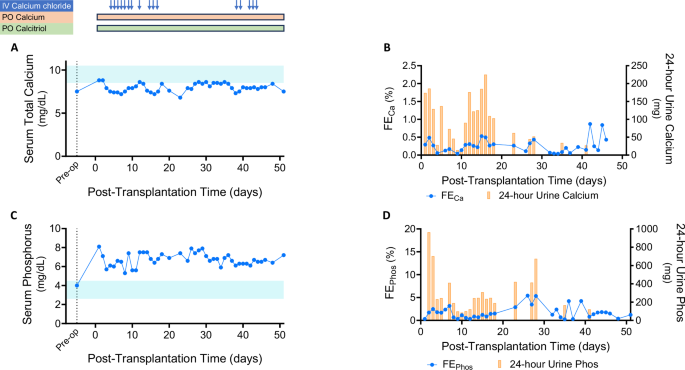
A Serum total calcium levels over time (light blue shaded area represents the normal range). The timing of calcium and calcitriol administrations is indicated by arrows and boxes. B Fractional excretion of calcium (blue line) and 24 hour urine calcium excretion (yellow bars) post-transplant. C Serum phosphorus trends (light blue shaded area represents the normal range). D Fractional excretion of phosphorus (blue line) and 24 hour urine phosphorus excretion (yellow bars). Source data are provided as a Source Data file. IV, intravenous; PO, by mouth; FECa, fractional excretion of calcium; FEPhos, fractional excretion of phosphorus.
Serum phosphate levels remained elevated (5.3-7.9 mg/dL) despite high-dose oral phosphate binders (Fig. 4C). Urinary phosphate excretion was limited, with fractional excretion of phosphate ranging from 0.3−4.2%. 24 hour urinary phosphate levels were generally below 600 mg, suggesting that his dietary phosphate intake was not excessive (Fig. 4D). This persisted despite elevated intact fibroblast growth factor 23 (FGF23) levels measured on POD 3, POD 18, and POD 26 (2659, 2449 and 3339 pg/mL, respectively). Intact PTH levels remained undetectable post-transplant. There was also no evidence of detectable PTH-related peptide (PTH-rP) during the follow-up period. Serum 25-OH Vitamin D levels were within the normal range, while 1,25 (OH)2-Vitamin D3 levels, initially low preoperatively, increased to 47 pg/mL with calcitriol supplementation. Collagen type 1b-telopeptide (collagen CTx) levels, a marker of bone resorption, were within the normal range before the transplantation but fell below the reference range post-transplant.
Uric Acid Balance
The recipient developed persistent hypouricemia (serum uric acid 0.3-0.7 mg/dL) due to increased urinary uric acid excretion (Fig. 5A). During the early post-transplant period, 24 hour urinary uric acid levels ranged from 0.9 to 1.6 g (Reference range 0.3–0.8 g/day), which later decreased as the recipient’s serum uric acid level reached a new steady state (Fig. 5B). The fractional excretion of uric acid remained elevated, ranging from 7% to 147% (reference range: 5−10%17). Uric acid crystals were intermittently observed on urine microscopy. However, there was no evidence of urate nephropathy on any of the three post-transplant xenograft biopsy samples.
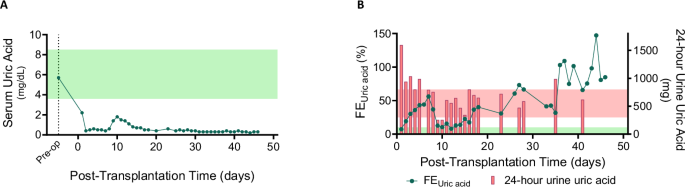
A Serum uric acid levels post-xenotransplantation (light green shaded area represents the normal range). B Fractional excretion of uric acid (green line) and 24 hour urinary uric acid levels (red bars). The light green area represents the normal fractional excretion range, while the light red area represents the normal 24 hour urinary uric acid excretion range. Source data are provided as a Source Data file. FEUric acid, fractional excretion of uric acid.
Magnesium Balance
Serum magnesium levels remained in the low-normal range, requiring intermittent intravenous and daily oral magnesium supplementation (Supplemental Fig. 5A, Supplemental Table 5). Increased urinary magnesium loss was observed, with fractional excretion of magnesium ranging from 2−11% and 24 hour urinary magnesium excretion between 100−250 mg (Supplemental Fig. 5B). Among drugs that may contribute to urinary and gastrointestinal magnesium wasting, the recipient was exposed to tacrolimus, furosemide, and a proton pump inhibitor during this follow-up period. On POD 51, serum magnesium dropped to 1.0 mg/dL, prompting the administration of 2 g of intravenous magnesium sulfate in addition to ongoing oral magnesium gluconate (1000 mg/day).
Glomerular Basement Membrane Integrity
In the early post-transplant period, albuminuria ranged from 0.1–0.4 g/day, increasing to 1.5 g/day on POD 9 during acute rejection. Following rejection treatment, urinary albumin loss was minimal, with a urine albumin-to-creatinine ratio (UACR) of 0.0–0.2 g/g (Fig. 6). Electron microscopy of the xenograft demonstrated intact glomerular basement membrane structure and interdigitating podocyte foot processes (Supplemental Fig. 6).
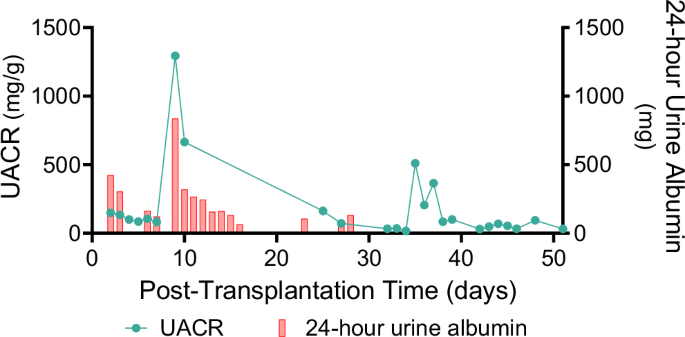
Post-transplant trends in spot urine albumin-to-creatinine ratio (green line) and 24 hour urine albumin levels (red bars). Source data are provided as a Source Data file. UACR, urine albumin creatinine ratio.
Erythropoiesis
The recipient developed normocytic normochromic anemia [hemoglobin 7.0-8.5 g/dL, mean corpuscular volume (MCV) 92.5–98.2 fL, mean corpuscular hemoglobin (MCH) 28.4−30.4 pg] post-transplant, likely due to surgical blood loss, repeated phlebotomy, procedural interventions, bone marrow suppression from immunosuppressants, and inflammation, including xenograft rejection. There was no evidence of iron, folate, or vitamin B12 deficiency nor signs of systemic thrombotic microangiopathy. Of note, pre-transplant hemoglobin levels ranged from 11.0-12.4 g/dL over 3 months.
A hypo-proliferative bone marrow response was suggested by a low reticulocyte index (0.2–1.7%). The recipient required three units of packed red blood cells during follow-up. He had not been receiving erythropoietin therapy before transplantation, and his plasma erythropoietin level increased from 3.6 mIU/mL preoperatively to 11.8 mIU/mL on POD 13. The potential cross-reactivity of the erythropoietin enzyme immunoassay (EIA) with pig erythropoietin had not been previously evaluated. Given concerns about the limited effectiveness of pig erythropoietin on human erythroid progenitors, darbepoetin (40 mcg weekly) was initiated on POD 15 after confirming iron repletion (transferrin saturation 83 % and ferritin 912 µg/L). Repeat erythropoietin level on POD 26 was slightly elevated at 13.4 mIU/mL. Despite treatment, the recipient remained mildly anemic throughout follow-up.